Chunkify dashboard
View playback reports in Chunkify.
Open Analytics in the Chunkify app to explore your audience, video engagement, and playback quality.
Connect your Analytics Server and set up playback tracking to start collecting data. The dashboard works with hosted and self-hosted servers.
The screenshots below use sample playback data. Select an image to view it at full size.
Choose a server and filters
Select your analytics server and a date range. Use Dimensions to focus on a video ID or title, a device, a location, or a website, or on your custom dimensions, such as a plan or an A/B test variant. Custom dimensions appear once views have sent them. Available filters vary by report.
Videos are named by their Chunkify Asset title when they have one, then by the videoTitle your player sent, then by their ID. A video title filter only matches views whose player sent that title, so filter by video ID to see every view of a video.
Overview
Start with Overview to see how much your videos are watched and how activity changes over time. Check total views and watch time, find your top videos, and get a quick picture of playback quality.
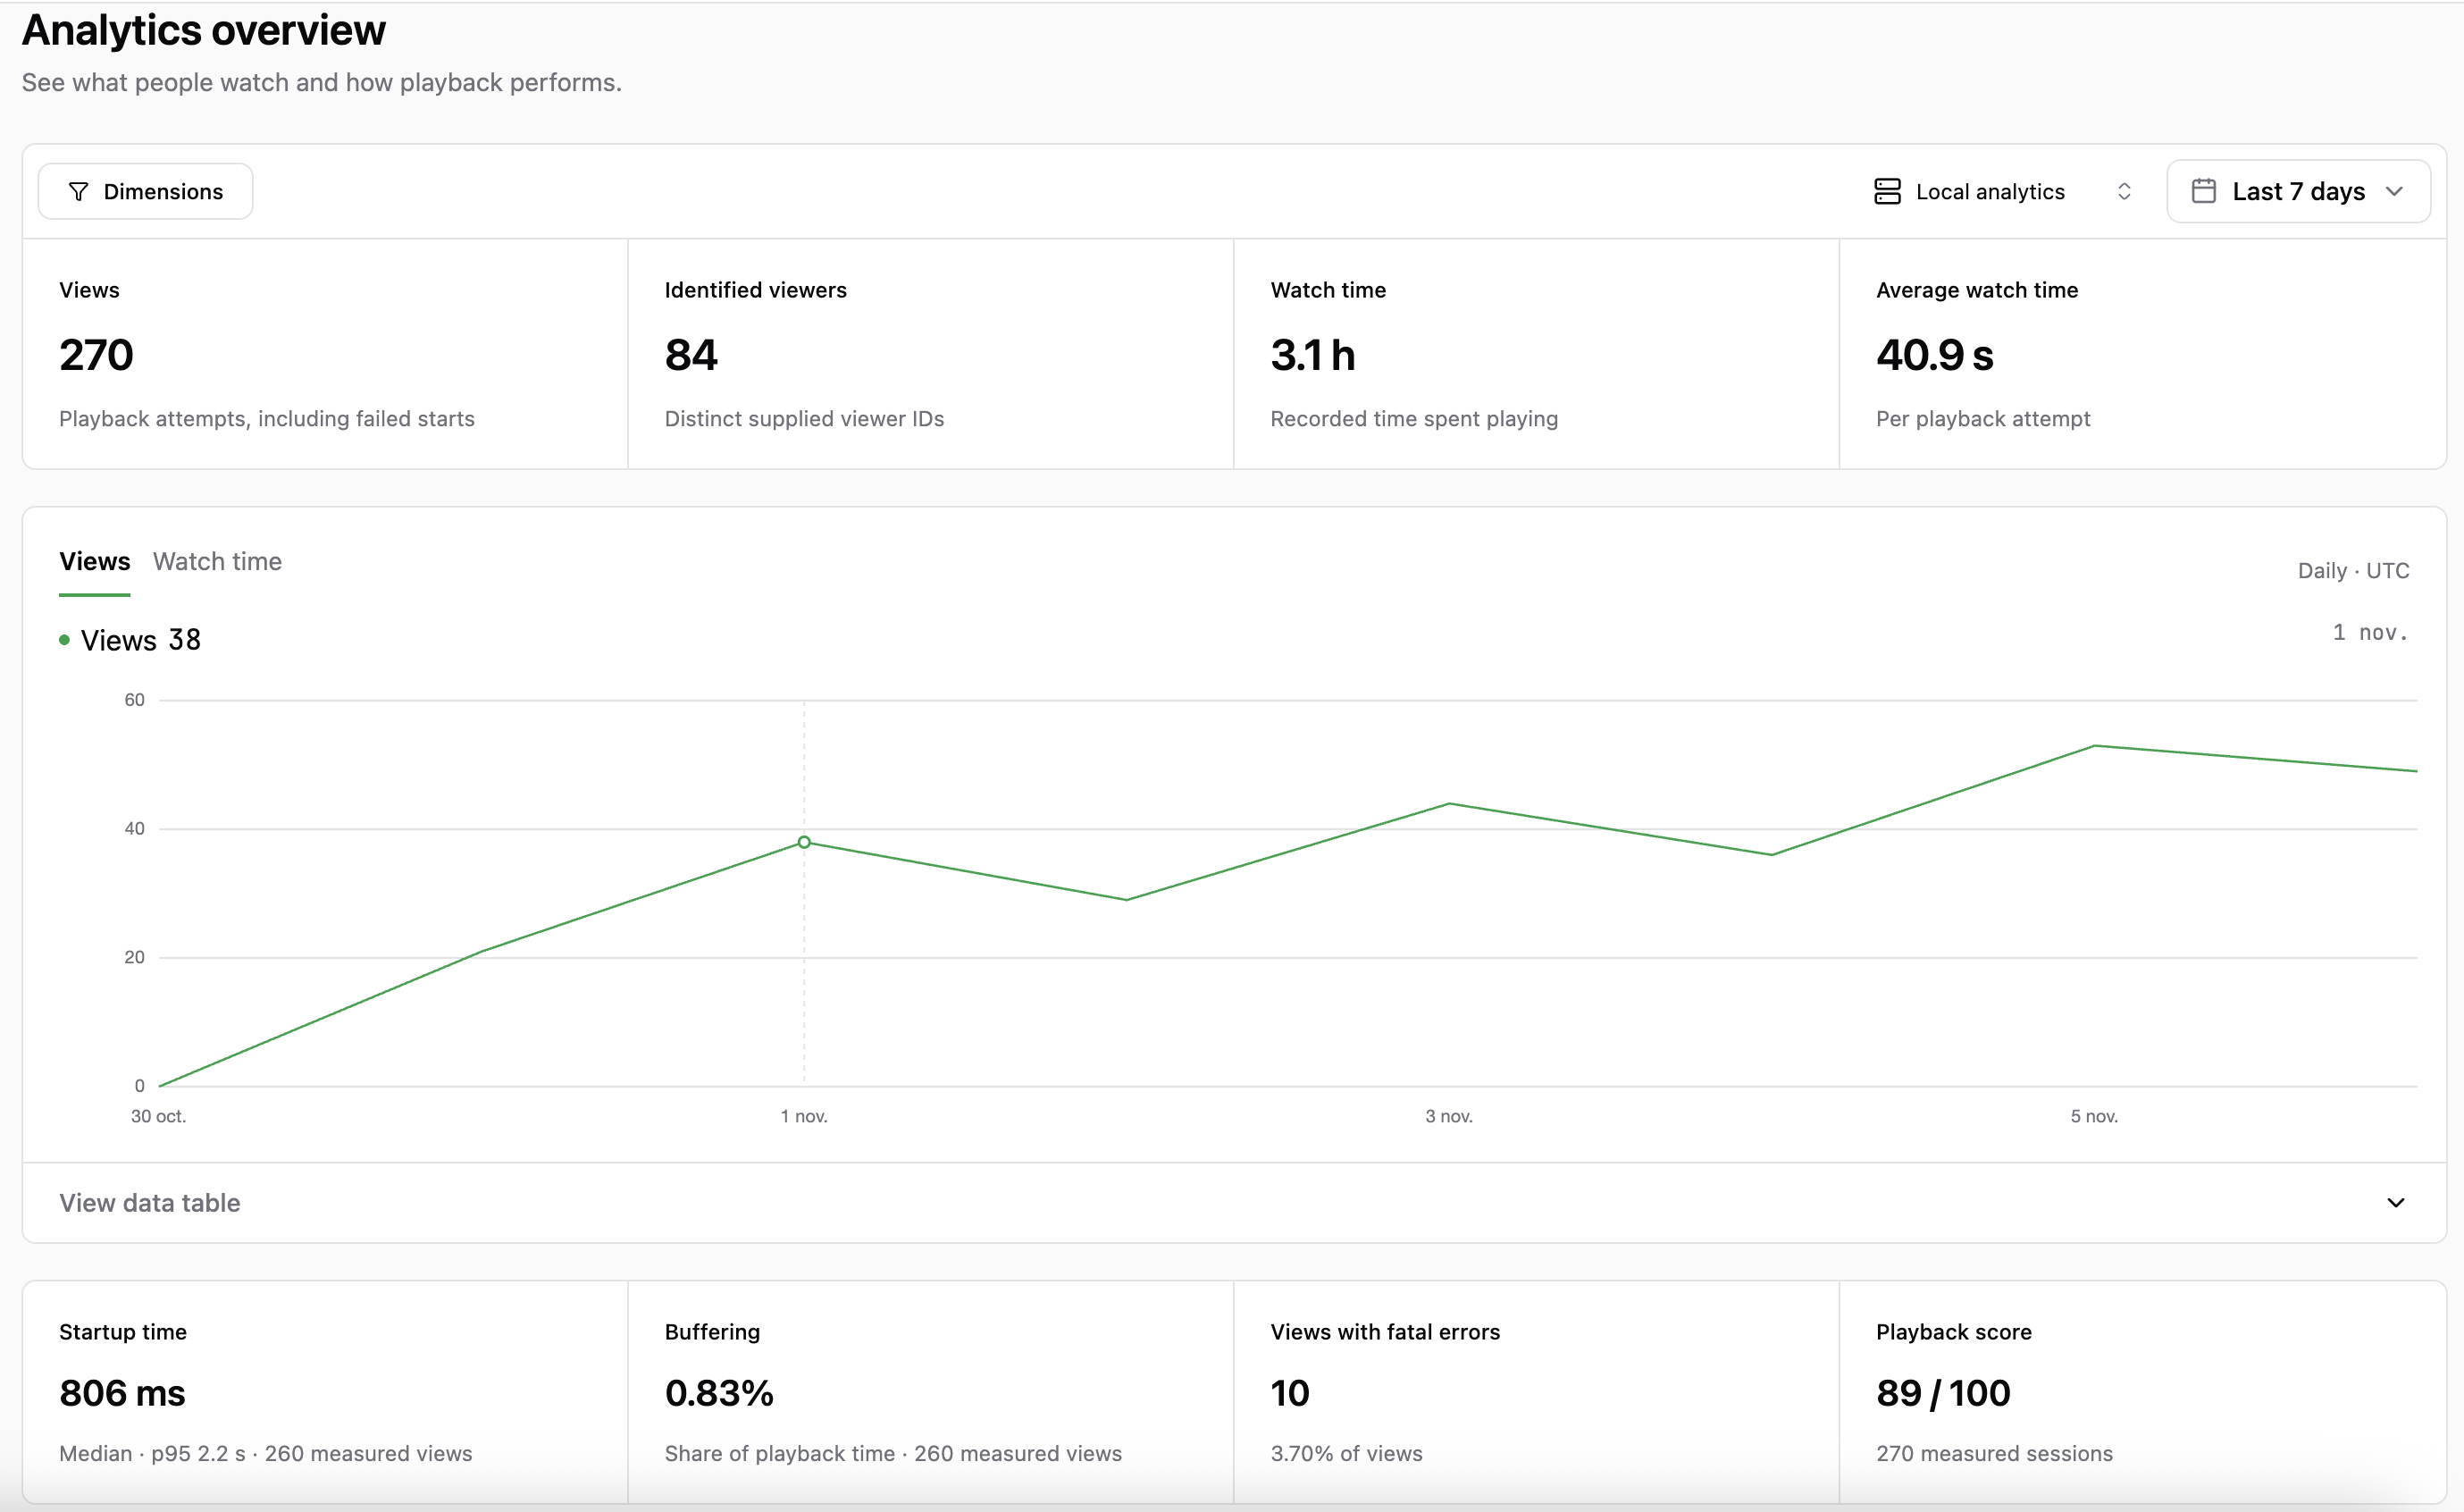
One viewer can contribute several views. Identified viewers counts distinct browsers: the tracker gives each browser an anonymous ID and reuses it across page loads. The same person on another browser or device, or after clearing site data, counts again. When the player is set not to store the ID until consent (persistViewerId: false), each page load counts as a new viewer.
Live
Open Live to see what is playing now and activity from the last 30 minutes. Follow incoming views, see which videos are active, and explore the devices and locations in your audience.
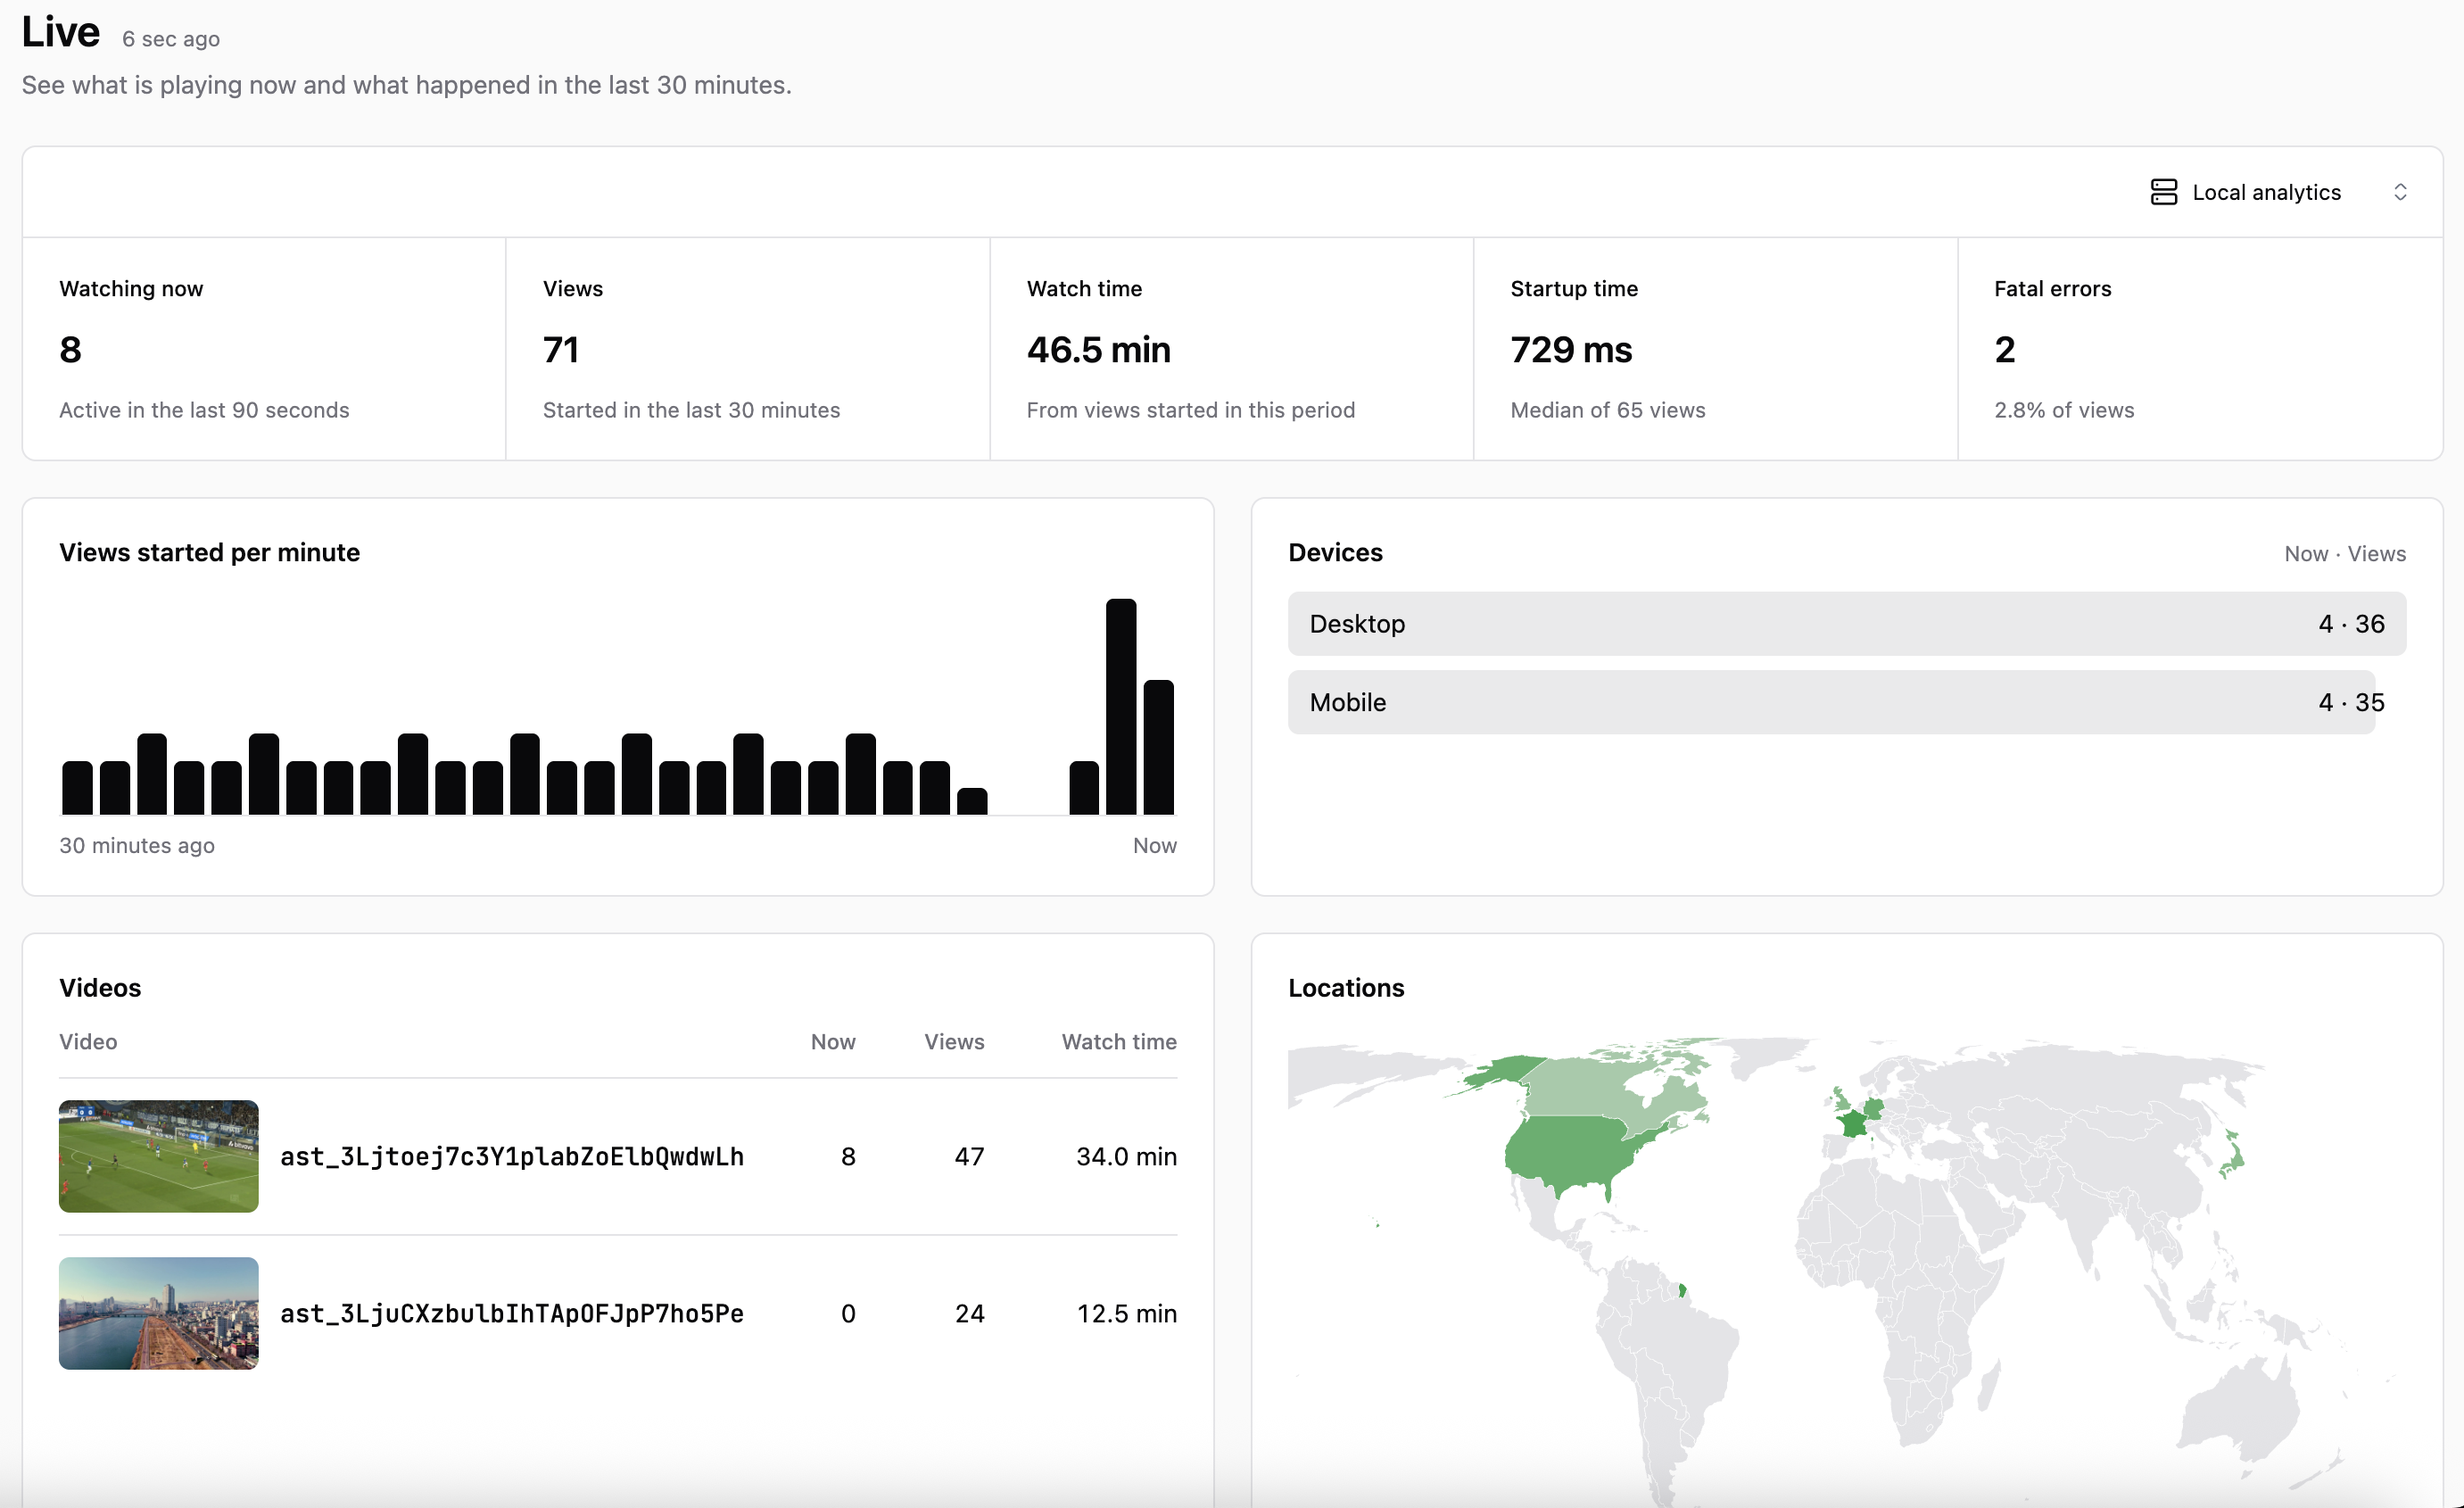
The page refreshes every 10 seconds while visible. Watching now counts active playback sessions, so it may include more than one session from the same viewer.
Playback quality
Use Playback quality to find slow starts, buffering, and playback failures. See how quickly videos begin playing and how many sessions start successfully. The playback score summarizes startup speed and playback smoothness.
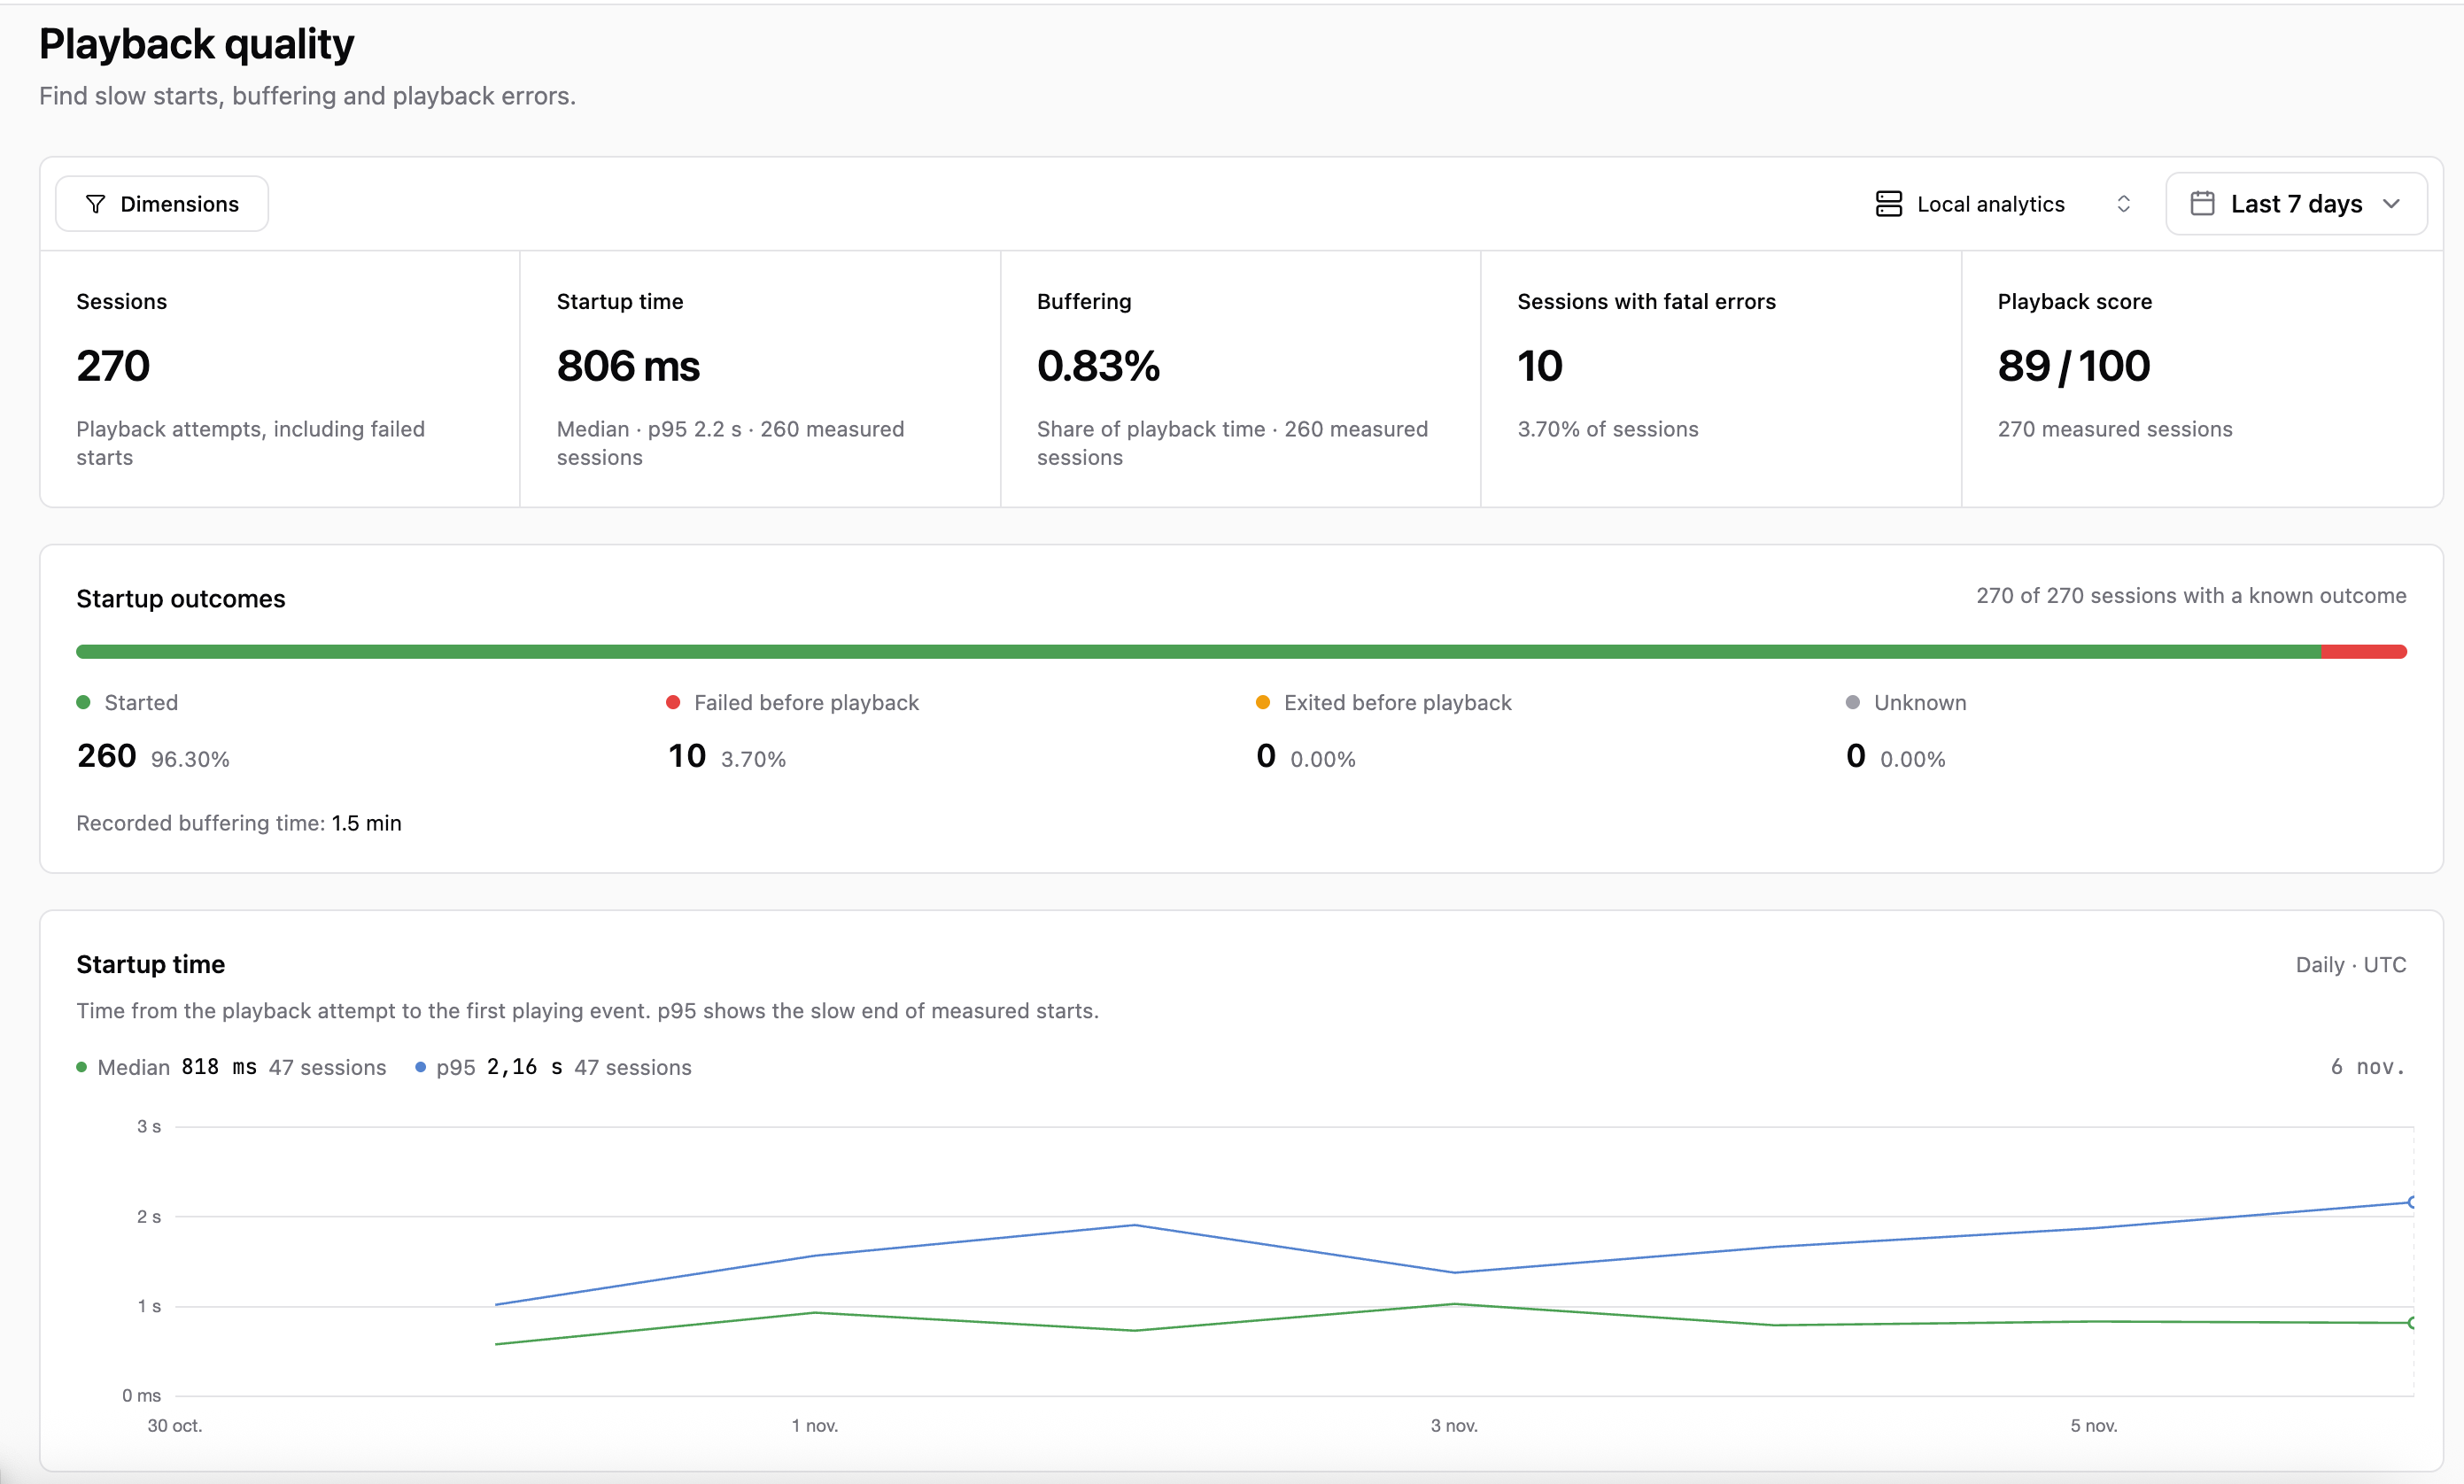
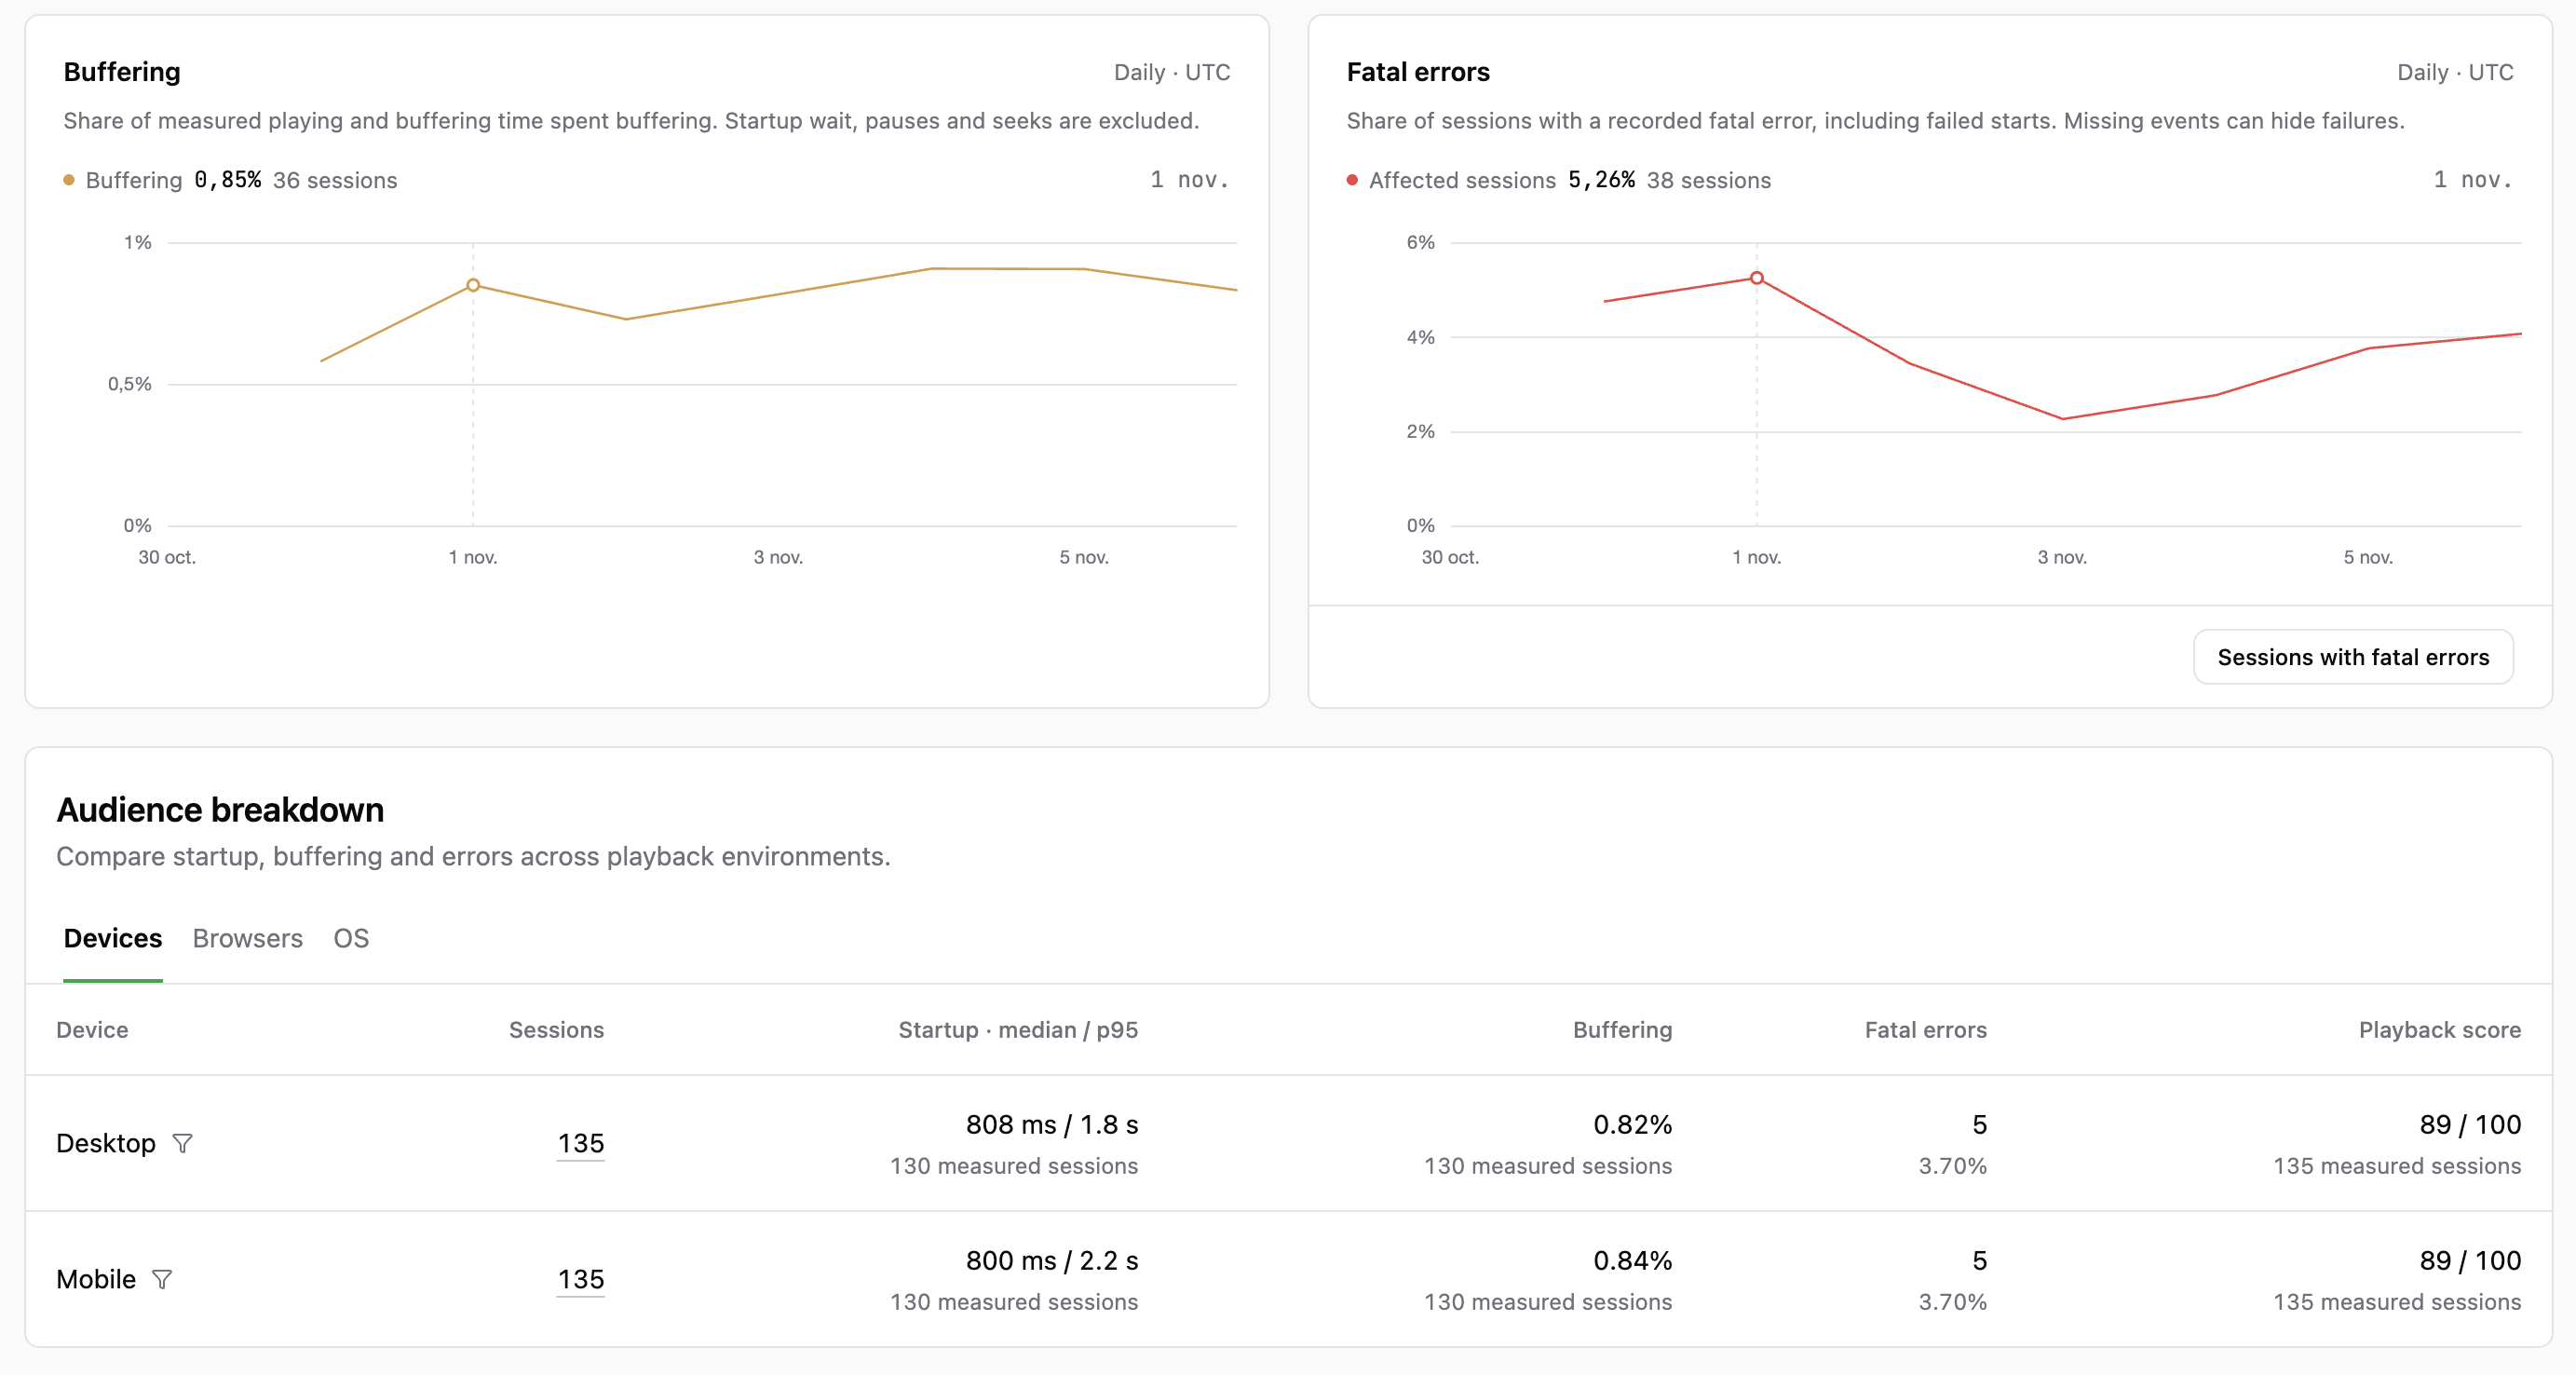
Follow buffering and error trends, then compare devices or browsers to see where playback problems are more common.
Engagement
Use Engagement to compare videos by views and watch time. Open a video to see its audience, activity over time, and how much of it people watch.
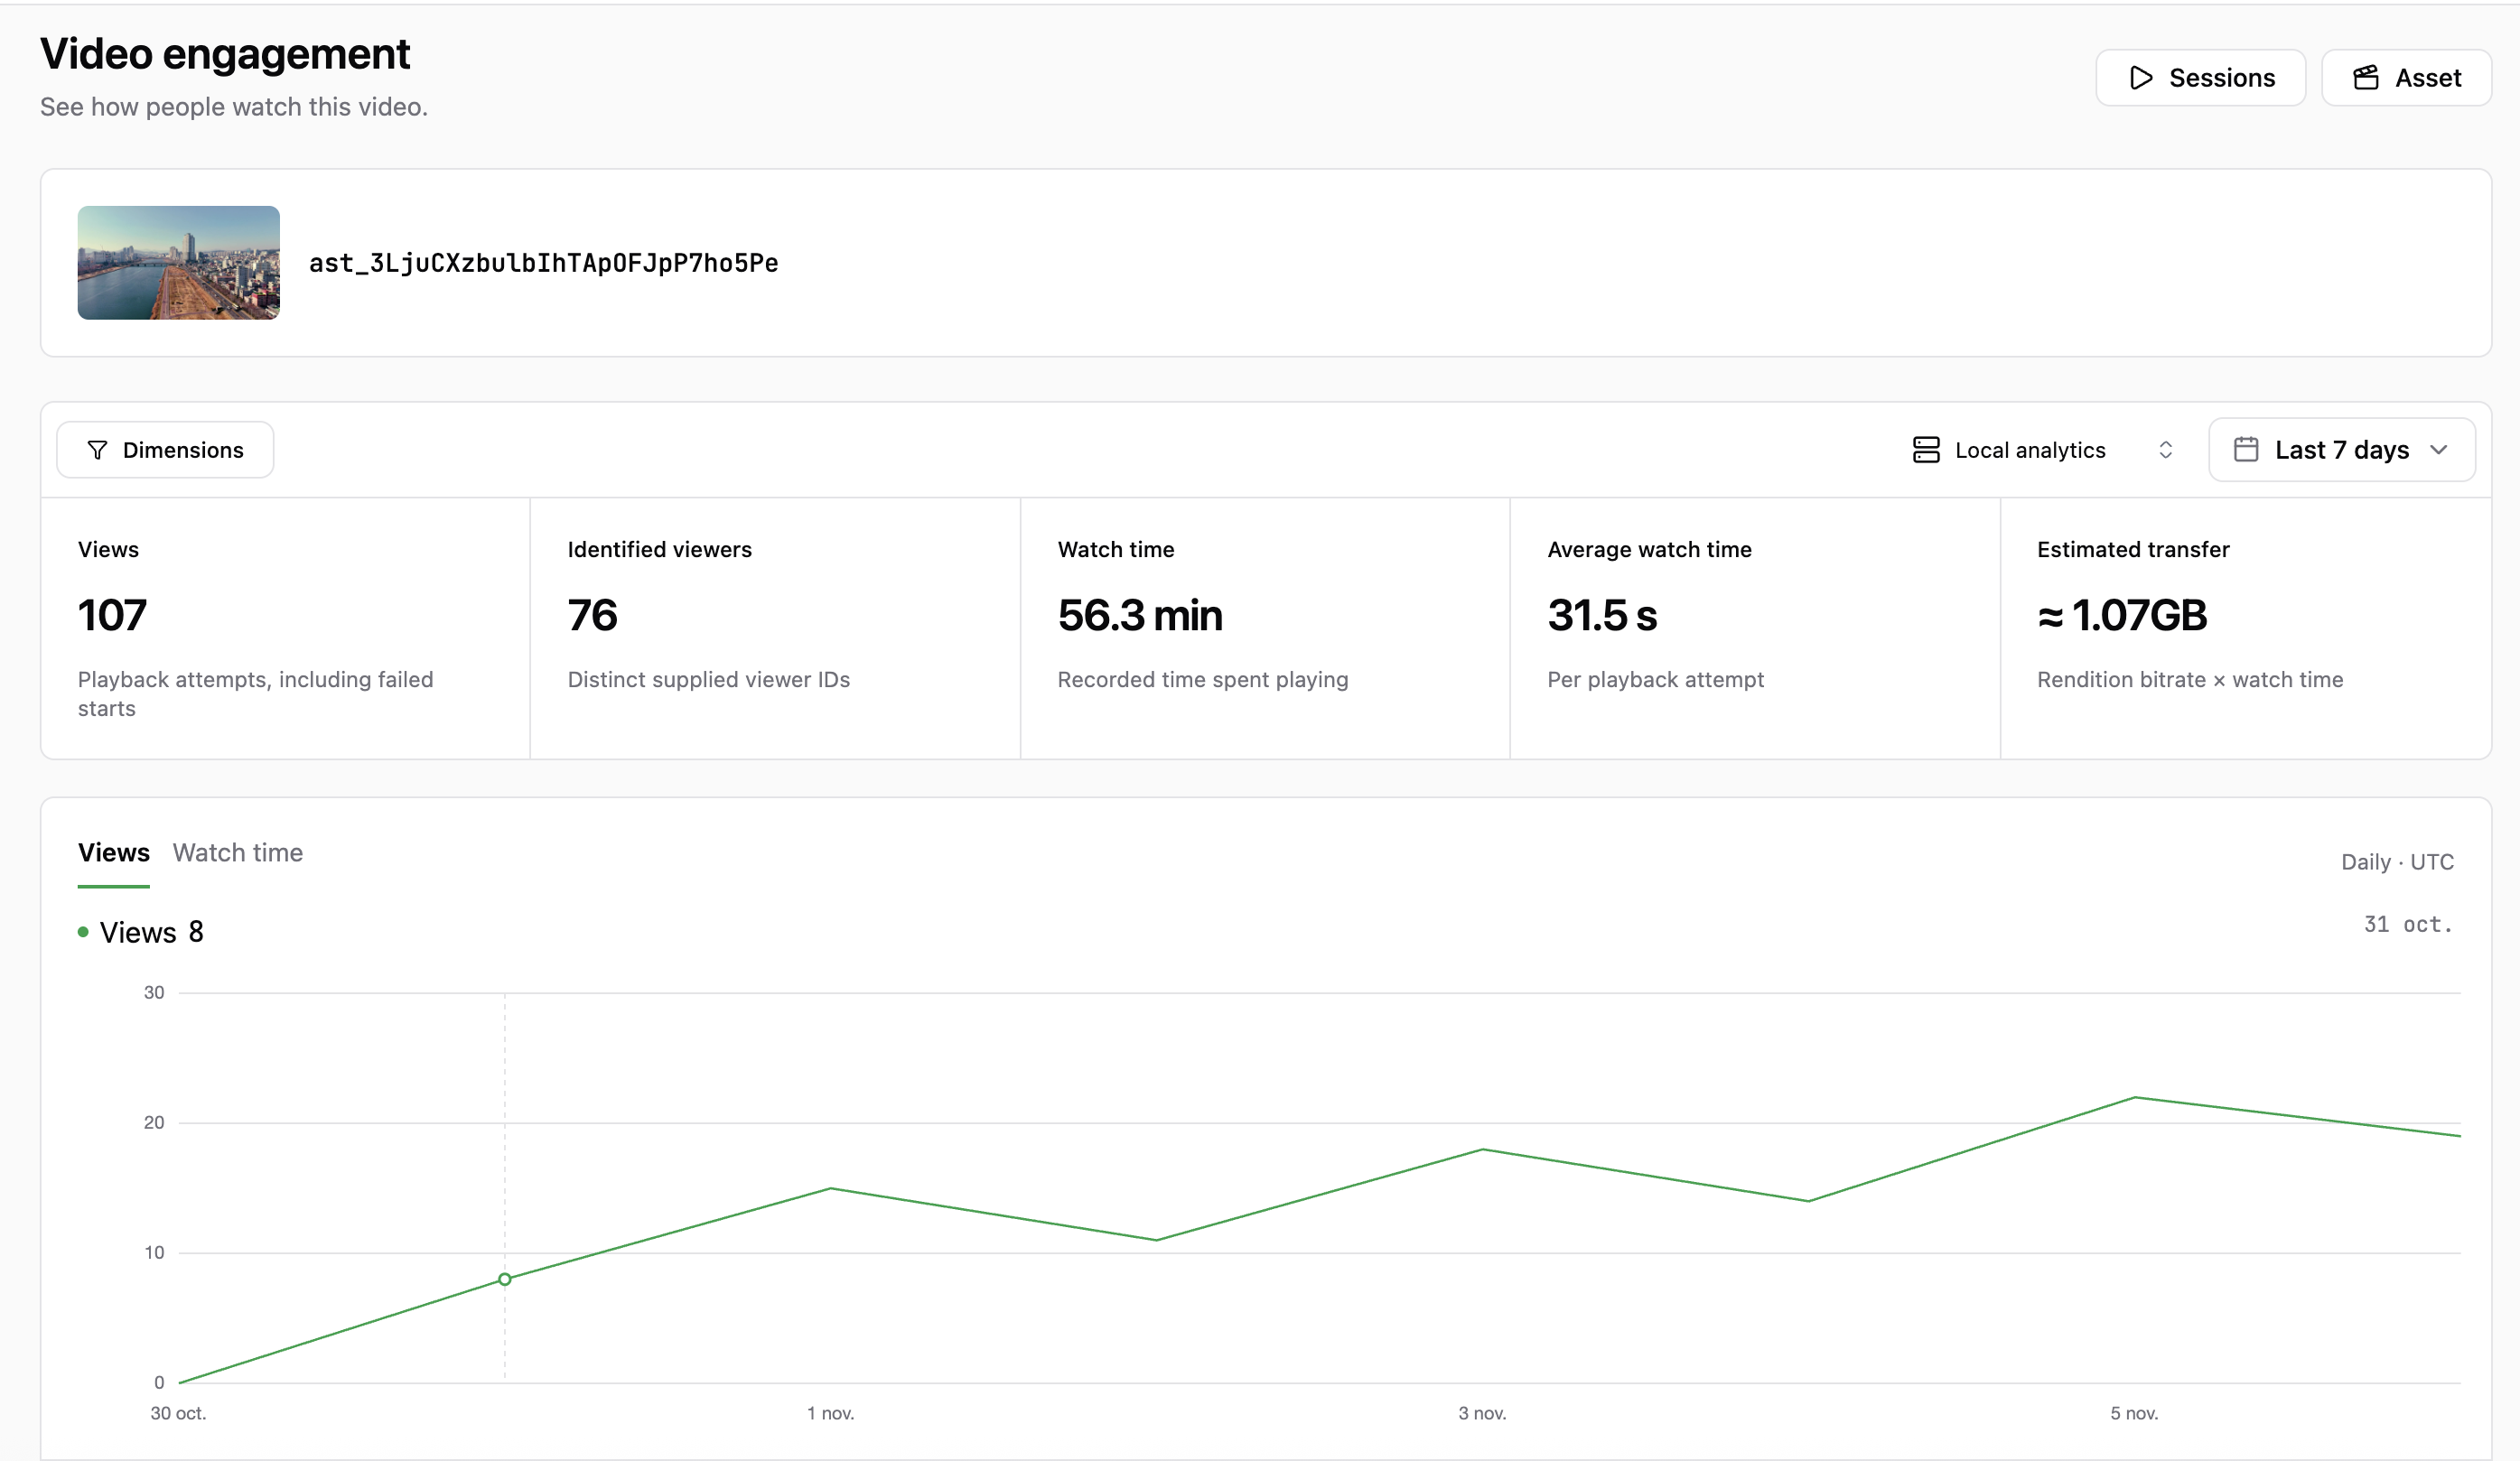
The watched-section chart shows which parts of a video were played. Sections skipped by seeking do not count as watched. Hover over the chart to inspect a section and see its thumbnail when available.
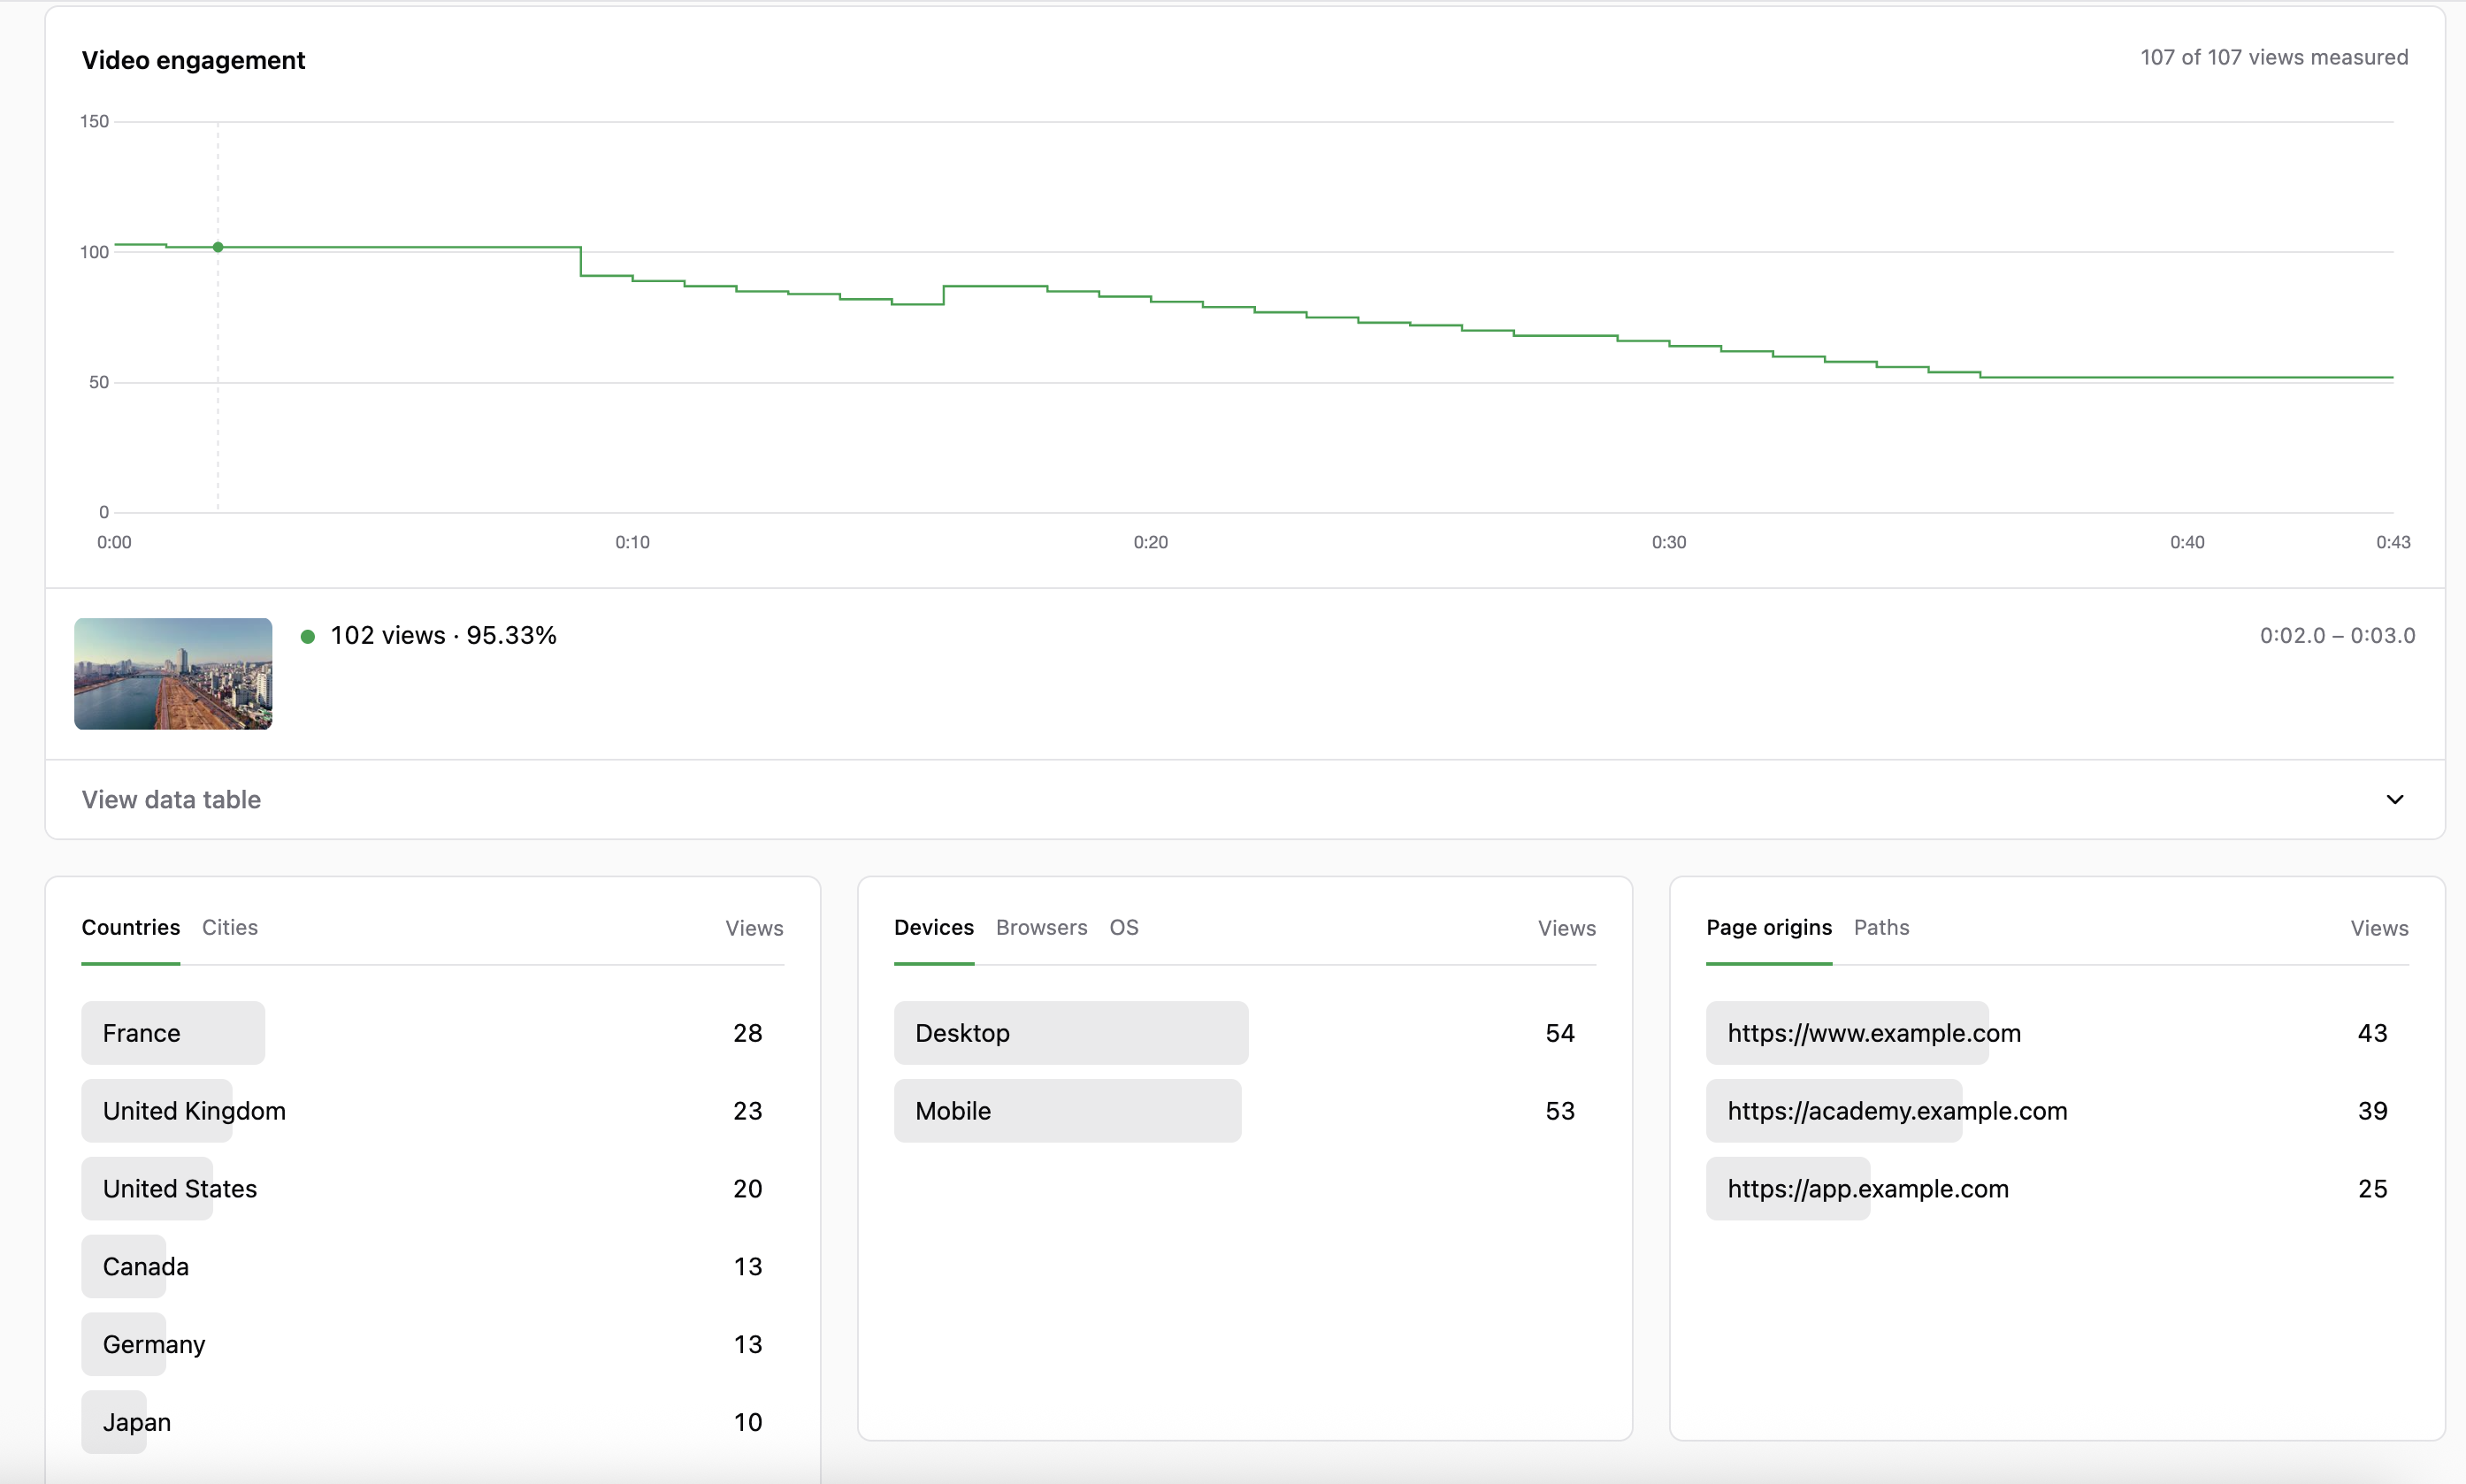
Below the chart, explore the video's audience by location, device, and website. The rendition, subtitle, and playback speed tables show how the video's watch time splits across renditions, subtitle languages (including time without subtitles), and playback speeds.
Sessions
A session is one playback attempt. Use Sessions to investigate an individual viewing experience, especially one with slow startup, buffering, or errors. Open a session to follow its playback timeline and see details such as the device, browser, video quality changes, and subtitle and playback speed changes.
Export CSV
Open Export, choose a report and date range, and select the columns you need. Download a CSV to explore the data in a spreadsheet or share a report with your team. The export includes all rows matching your filters.
Understand freshness and missing data
Reports update as playback data arrives, so recent activity may take a little time to appear. Available history depends on your server's data retention settings.
For details on how the numbers are calculated, see metric definitions.